RNA 3D Motif Atlas
Extracts and clusters hairpin loops, internal loops and junctions. Complex crossing topologies such as pseudoknots are hard to handle systematically.
PH.D. DISSERTATION PENN STATE · 2026 DOKHOLYAN LAB
Protein structure prediction did not get solved by a better idea alone. It got solved on top of 180,000 experimental structures. RNA has roughly two thousand, and a good share of those contain atoms sitting inside each other or missing entirely. So this work went after the data instead of the model.
THE GAP
Why the RNA field did not get an AlphaFold
RNA and protein groups now reach for the same tools: attention over pair representations, geometric networks, diffusion. The results are not the same. In the most recent RNA-Puzzles round, the best submissions land between 1.2 and 5.0 Å on small elements, and between 6.0 and 21.2 Å on ribozymes. Protein prediction stopped quoting numbers in that range years ago.
The usual explanation is that RNA folding is harder, and it is. But there is a plainer reason sitting underneath. Every year the Protein Data Bank grows by more than ten thousand protein structures. It grows by fewer than two hundred RNA ones.
Structures released per year, 2016 to 2025
On one shared axis the RNA series is not small. It is close to invisible. Switch to separate scales to read the RNA numbers at all, and notice that doing so is the only way to make them legible.
And the data you do have is bruised
RNA has seven backbone torsion angles to pin down per nucleotide. A protein residue has two that matter. At the 2 to 4 Å resolution where much of the RNA archive lives, that extra freedom has to be resolved by the model builder rather than by the density, and it shows: atoms overlap, side atoms go missing, geometry drifts.
Training a network on those files is not neutral. The network has no way to know that an overlap is a measurement limit rather than a fact about RNA, so it learns the artifact along with the chemistry.
ATLAS
Chapter 2 · getting more out of what exists
RNA reuses itself. The same hairpin loops, internal loops, bulges and junctions turn up across unrelated molecules, which is why fragment assembly works at all. Cut 8,700 structures into their recurring pieces and a few thousand files become a few hundred thousand training examples. Motif libraries have done this for years. The question is what they throw away on the way.
Extracts and clusters hairpin loops, internal loops and junctions. Complex crossing topologies such as pseudoknots are hard to handle systematically.
Uses Watson-Crick and wobble pairs as the only boundary for cutting motifs. Motifs with matching interactions but different lengths end up filed apart.
Pseudoknots get stripped out before analysis so the notation stays simple. The structures that are most worth studying are the ones that get removed.
The move
Nucleotides are nodes. Interactions are edges, tagged by type: covalent backbone, Watson-Crick pair, non-Watson-Crick pair. MC-Annotate reads the atomic coordinates and reports which is which. Once the molecule is a graph, "find every hairpin loop with six unpaired nucleotides" stops being a geometry problem and becomes an exact subgraph isomorphism search, immune to the coordinate wobble that trips up methods matching on distances.
Turn the edge types on and off. The nodes never move.
How ATLAS gets built
What came out
Bars are scaled against the largest category, not against the full library.
Internal loops dominate at half the library. Bulges cluster tightly: 98% of them are one to three nucleotides, and two thirds are a single nucleotide. Hairpin loops peak at four nucleotides, the tetraloop everyone expects. Nothing here is a surprise, which is the point. A library that disagreed with known RNA statistics would be a library with a bug.
The interesting number is further down the list. Only 1.6% of the entries are pseudoknots, and those are the entries most previous libraries removed on purpose.
distinct motifs, once non-Watson-Crick pairs are allowed to count
This is the result that justifies the whole approach. Classify on Watson-Crick pairs alone and a hairpin loop with four unpaired nucleotides is a single entry in the library. Let the non-Watson-Crick hydrogen bonds into the graph and that one entry splits into 1,487 topologically distinct things, because Hoogsteen and sugar edge contacts are doing real structural work inside the loop.
Those are not slight variants of each other. They are different molecules that a Watson-Crick classifier was quietly merging. Among loops with six unpaired nucleotides the most common arrangement accounts for 41.4% of cases and the rest spread across a long tail.
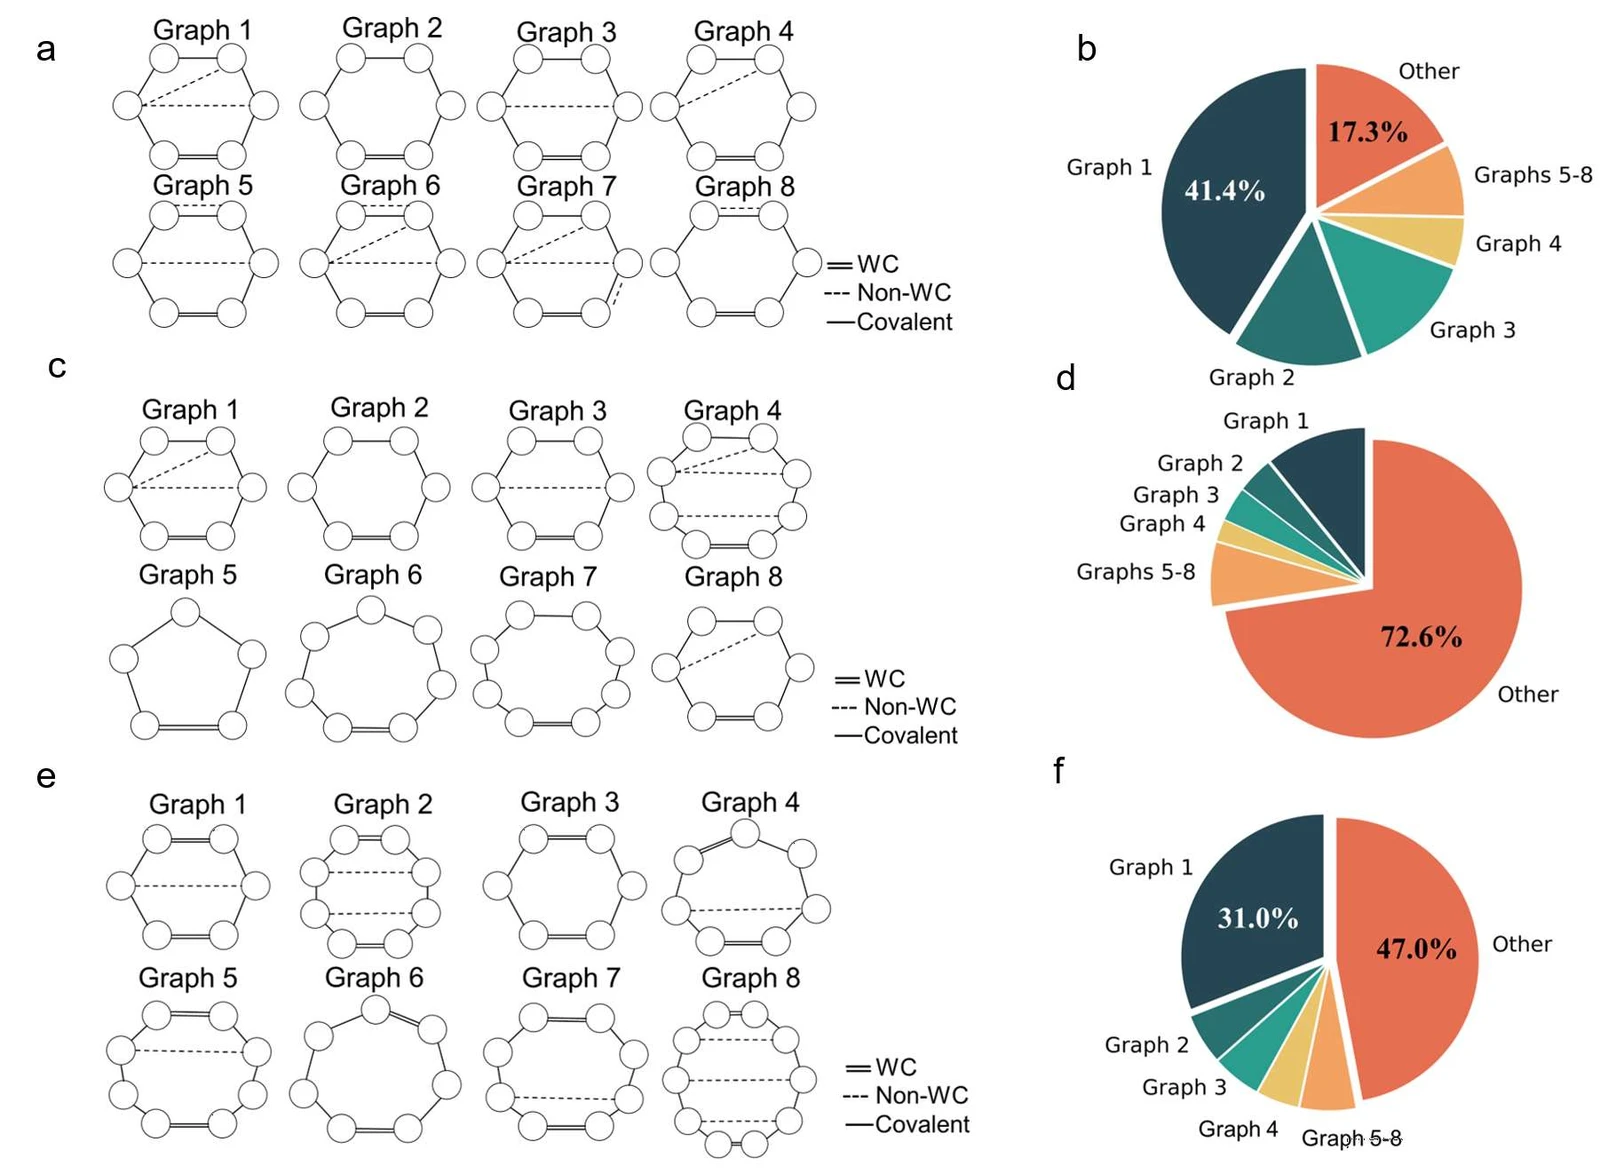
Each small hexagon or pentagon is one motif drawn as a graph. Solid double lines are Watson-Crick pairs, dashed lines are non-Watson-Crick, thin lines are the covalent backbone. Panels a, c and e show the eight most frequent arrangements; b, d and f show how the population splits between them. The large "Other" slices are the tail, and the tail is the finding: most of these motif families are not dominated by one canonical shape.
The part everyone deletes
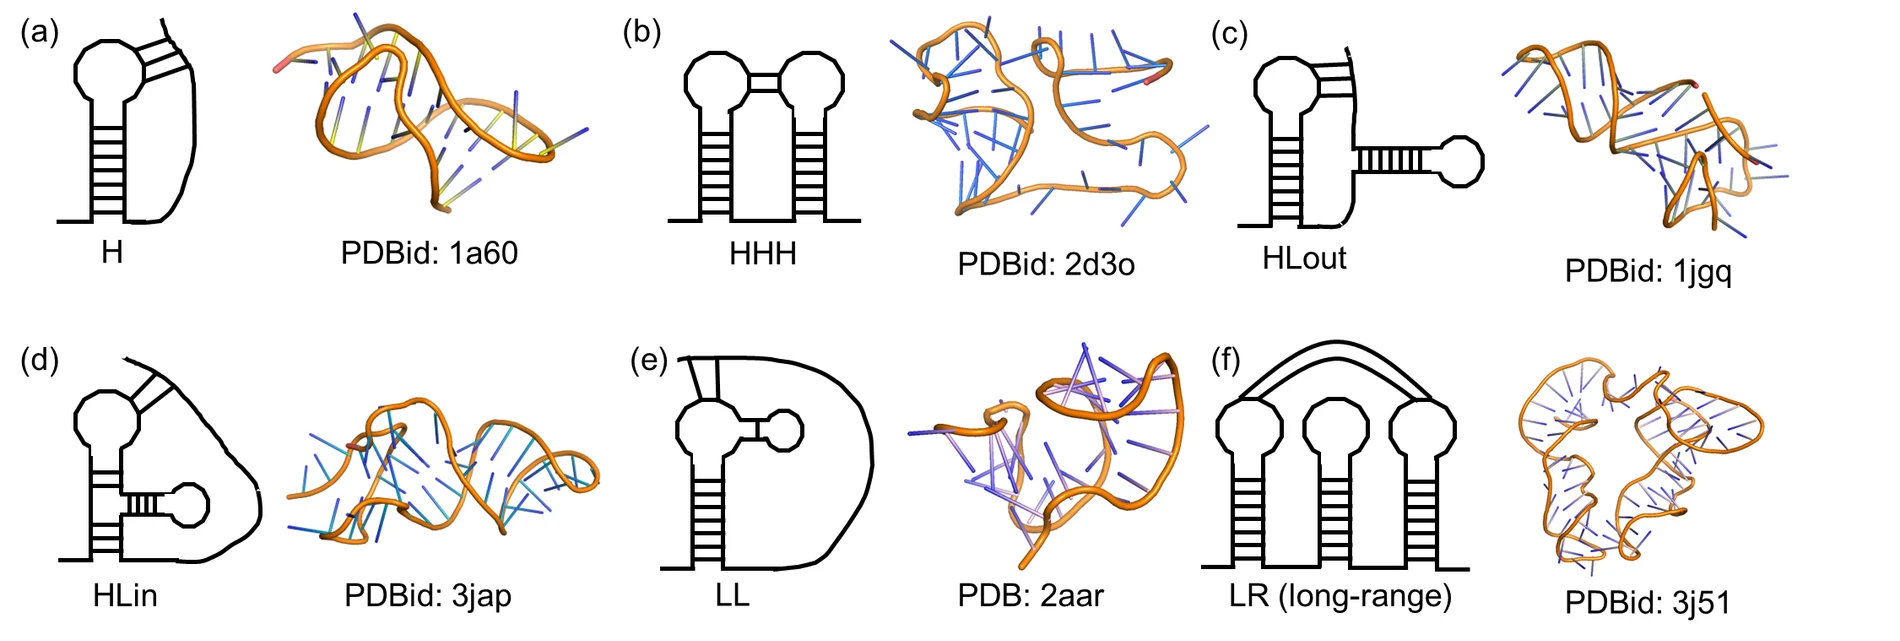
A pseudoknot is what happens when a loop pairs with something outside its own hairpin. In dot-bracket notation those crossing pairs are awkward, so the standard fix is to remove them and carry on. ATLAS keeps them by converting the graph back into an extended dot-bracket form that can carry the crossings, then classifies what it finds.
The distribution reads like a thermodynamic argument. Simple topologies are common because simple topologies are cheap to hold together. The long-range class leads not because it is one shape but because it is a catch-all for combinations that do not reduce to the other five.
Hairpin loops alone took over an hour on a desktop processor. Internal loops and junctions need more query patterns and larger graphs, and the cost climbs close to exponentially with graph size, so a straight search across the whole Protein Data Bank was not going to finish.
The fix is a compression step. A run of consecutive unpaired nucleotides carries no branching information, so it gets collapsed into a single edge that stores the nucleotides it swallowed as a weight. The search runs on the compressed graphs, and the matches are decompressed afterwards to recover the real motif. This removes both the graph size and the need to enumerate one query pattern per loop length, which is what made a full sweep of the archive possible at all.
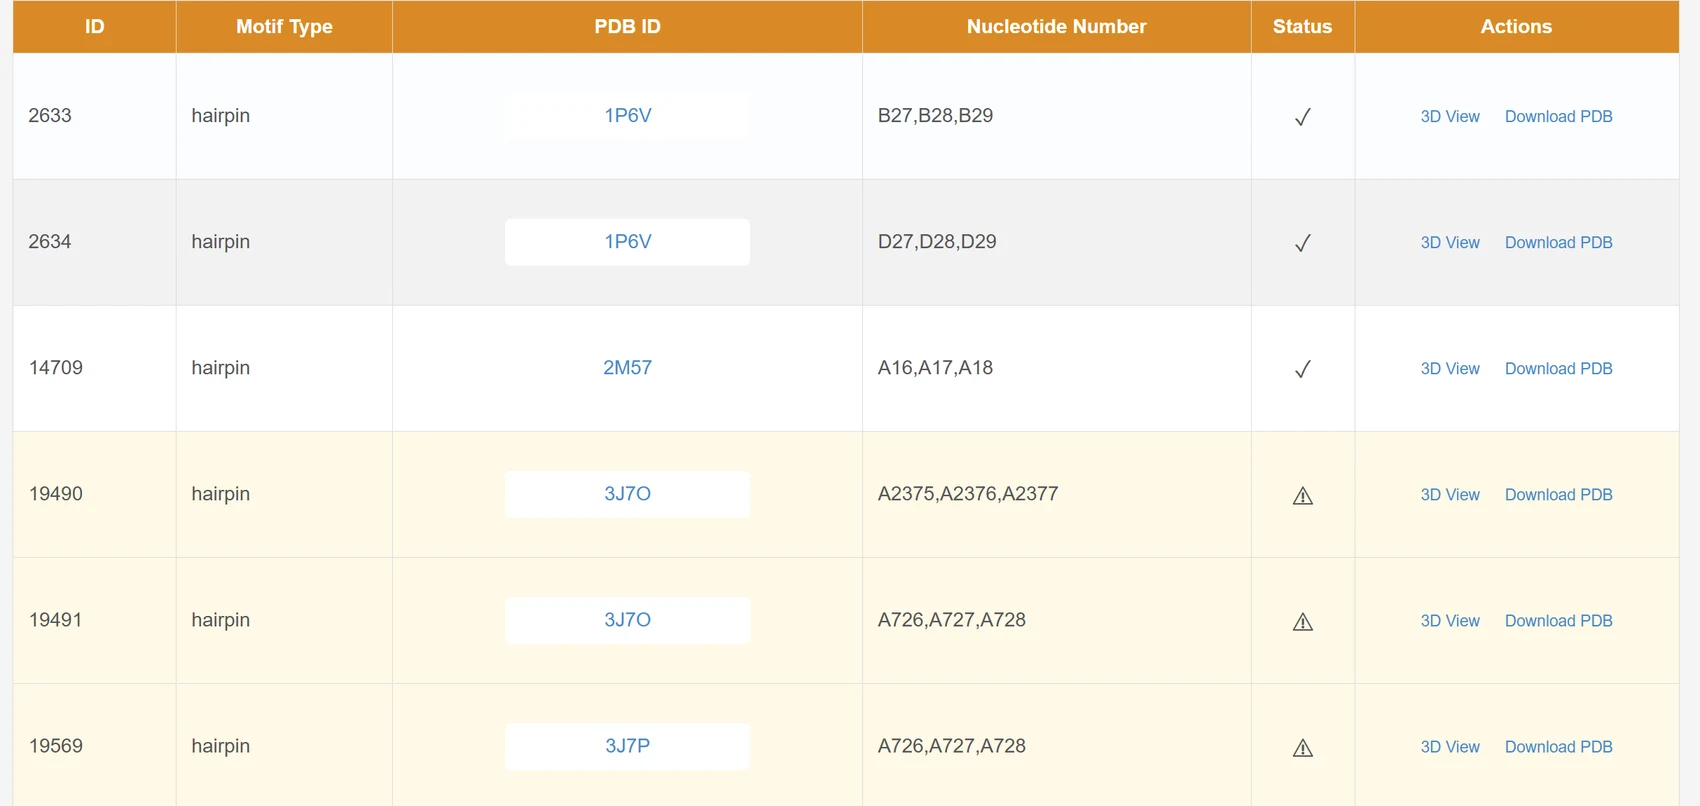
Pick a motif type and size and the table returns every match with its source structure, downloadable as coordinates or as a spreadsheet. The custom search gives you a canvas: place nucleotides, draw the interactions you care about including non-Watson-Crick ones, and the same subgraph search runs against the whole archive. Entries carry a status flag when atoms are missing or the geometry is poor, which is where the second half of this dissertation starts.
A DETOUR
An unplanned result
Once every molecule is a bag of motifs, comparing two RNAs stops being a sequence alignment problem. Match their motifs to each other, score each pair with a Weisfeiler-Lehman graph kernel, weight by motif size and non-Watson-Crick content, and you get a similarity number that is about shared structural vocabulary rather than shared letters.
The first check was the boring one. RNAs in the same Rfam family should look more alike than random pairs, and they do: median similarity 0.69 within a family against 0.26 between families, with the difference holding under a Mann-Whitney test. Fine. The measure works.
The second thing was not expected. Plot the similarity scores for every pair in the archive on log axes and the distribution is a straight line with slope near one half. That is not what a bag of unrelated accidents looks like.
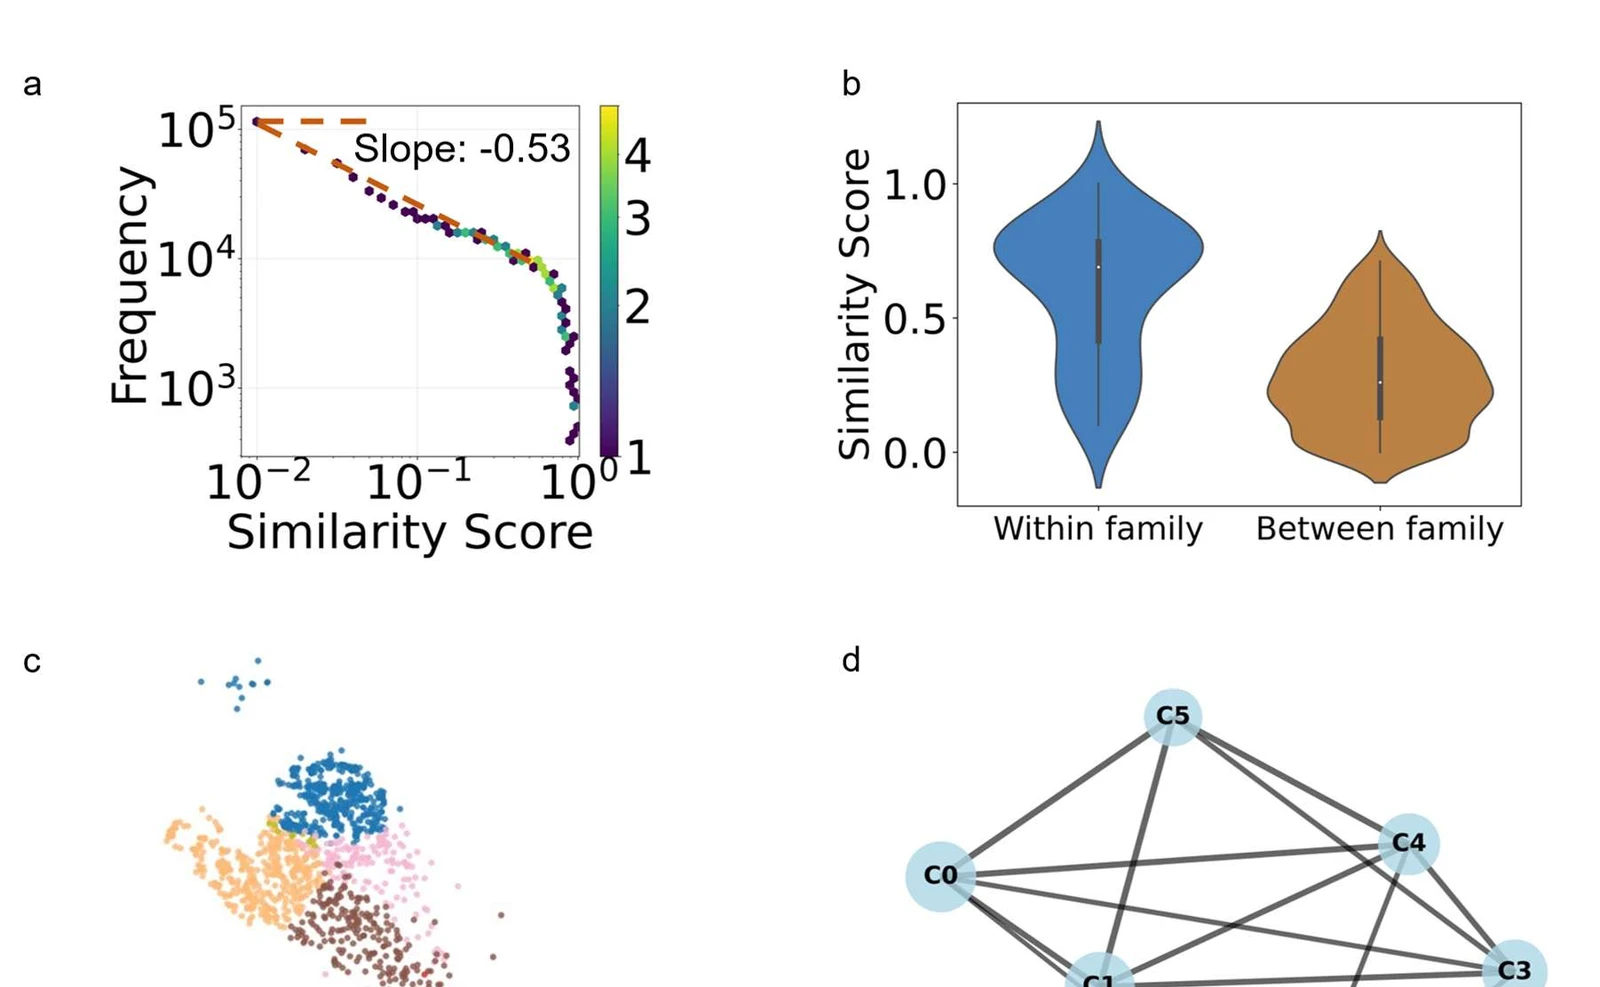
Panel a is the one to look at. Frequency against similarity score, both axes logarithmic, fitted slope −0.53. A steady state, not a random walk. Panels c and d show what happens when you cluster on that similarity: RNAs separate into groups that hold together, and the groups themselves form a connected map.
A physics analogy, taken seriously enough to solve
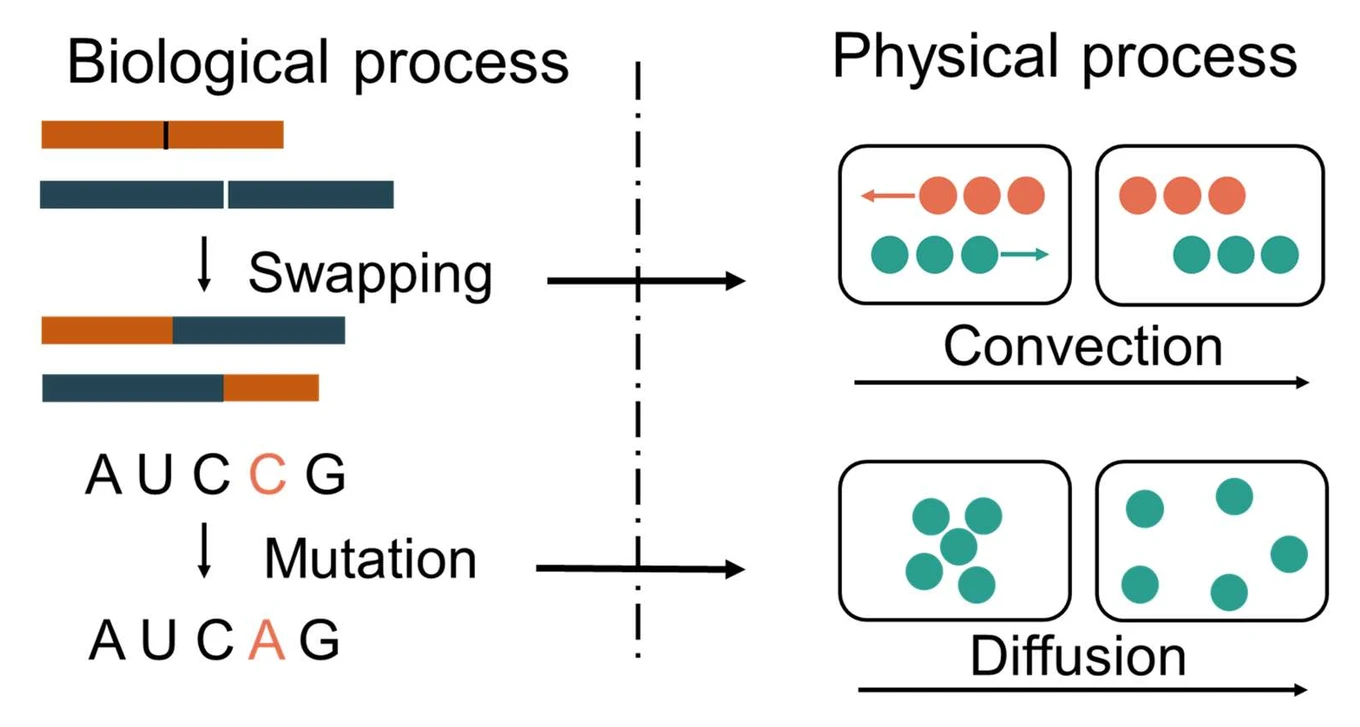
Point mutations move a molecule a small random distance in similarity space with no preferred direction. That is diffusion. Recombination and motif swapping move it a long way and in a direction that selection cares about. That is a drift term. Put both into a Fokker-Planck equation for the frequency of similarity scores and ask what its steady state looks like.
Setting the time derivative to zero and solving for the drift coefficient that reproduces the observed distribution gives something clean: the drift is inversely proportional to similarity. Two RNAs that barely resemble each other are far more likely to be moved by a swap than two that already share most of their vocabulary.
CHIRONRNA
Chapter 3 · fixing what the archive got wrong
A steric clash is two atoms occupying space they cannot share. The structure is real data, it is just locally impossible, and it sits at the bottom of a deep energy well with a wall around it. Every refinement method that works by going downhill is stuck the moment it starts, because downhill is exactly where it already is.
Why gradient descent loses
Molecular dynamics, simulated annealing and gradient descent all refine by moving the current conformation a little at a time. When the defect is mild that works. When two atoms are 0.8 Å inside each other, escaping requires going uphill first, and these methods have no reason to. Enumerative approaches such as exhaustive backbone search do escape, but the number of conformations per nucleotide makes the cost explode once interactions between nucleotides count.
Diffusion offers a third option. Add enough Gaussian noise to the clashing region and the barrier stops existing, because the structure that was trapped no longer exists. Then denoise, using the untouched part of the molecule as the condition, and let the network put atoms somewhere physically plausible.
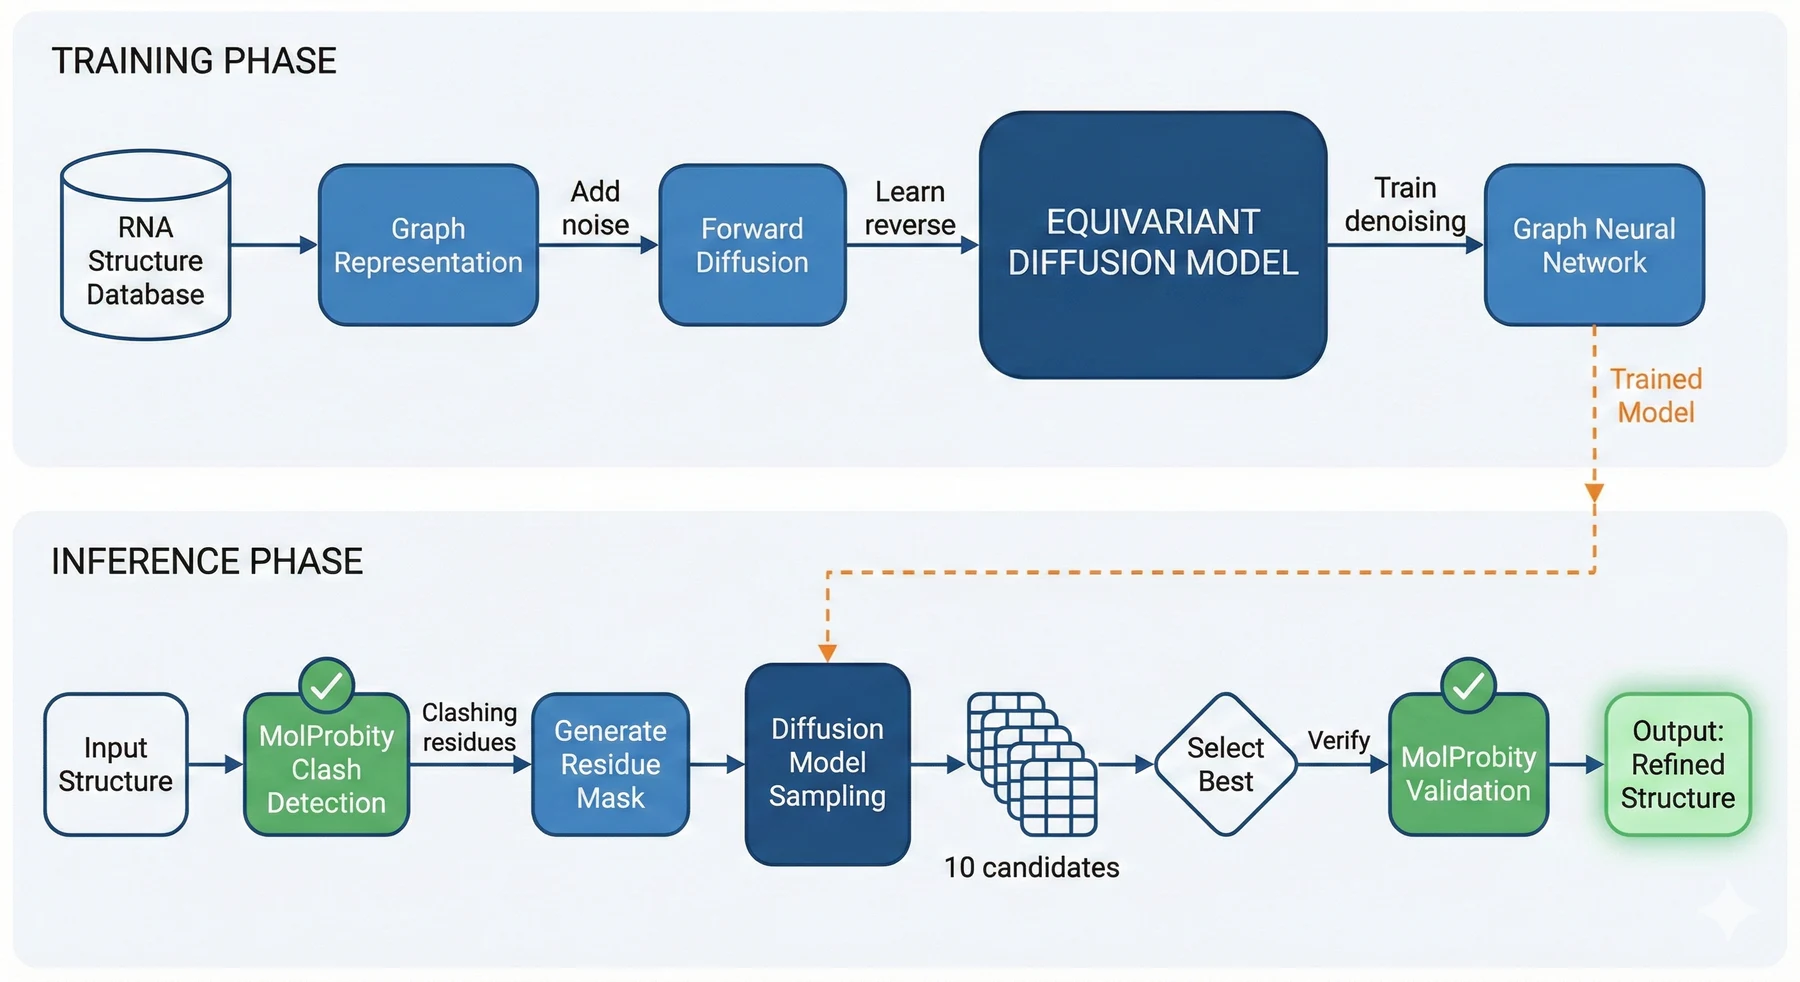
The top row trains the network to predict the noise added to a structure it can see. The bottom row uses it: MolProbity places hydrogens, finds atom pairs overlapping by more than 0.6 Å, and hands back a list of residues. Those become the region to regenerate. Ten candidates get sampled, MolProbity scores each one, and the best goes out. If none of them beat the input, the input is returned untouched.
Why the network has this particular shape
Rotate a structure and its energy does not change. A network that treats coordinates as raw numbers has to learn that fact from data, wasting capacity on something that was true before training started. An E(3)-equivariant graph neural network builds it in: messages depend on squared distances between atoms rather than absolute positions, and coordinate updates are applied along the vectors connecting atoms.
The input below carries a clash: two atoms pushed into each other. The output is the same fragment with that clash resolved. Rotate the input and the output turns by exactly the same amount, because nothing inside the network ever saw an absolute coordinate.
What regeneration actually looks like
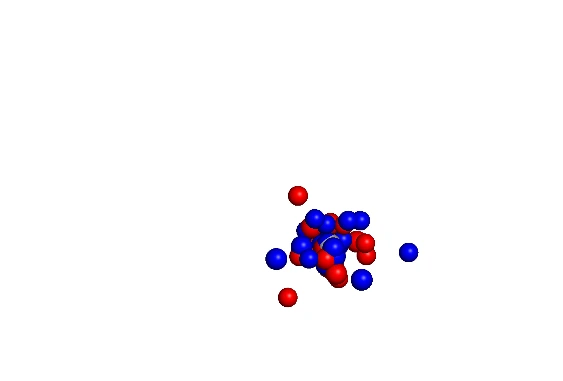
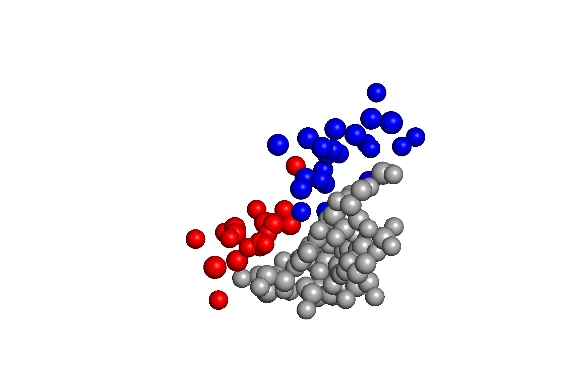
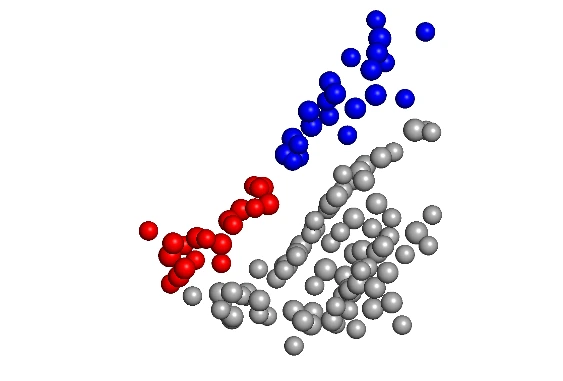
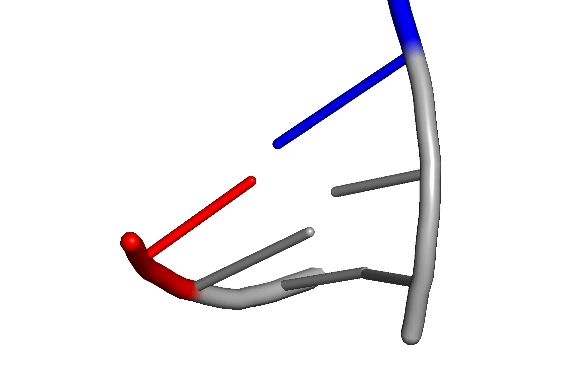
Grey atoms are the constraint: high quality regions of the molecule, held fixed throughout. Red and blue atoms are the nucleotides being regenerated. At the start they are a single indistinct blob, because Gaussian noise has removed every trace of the original geometry along with the clash. Watch the order in which structure returns.
Does it work
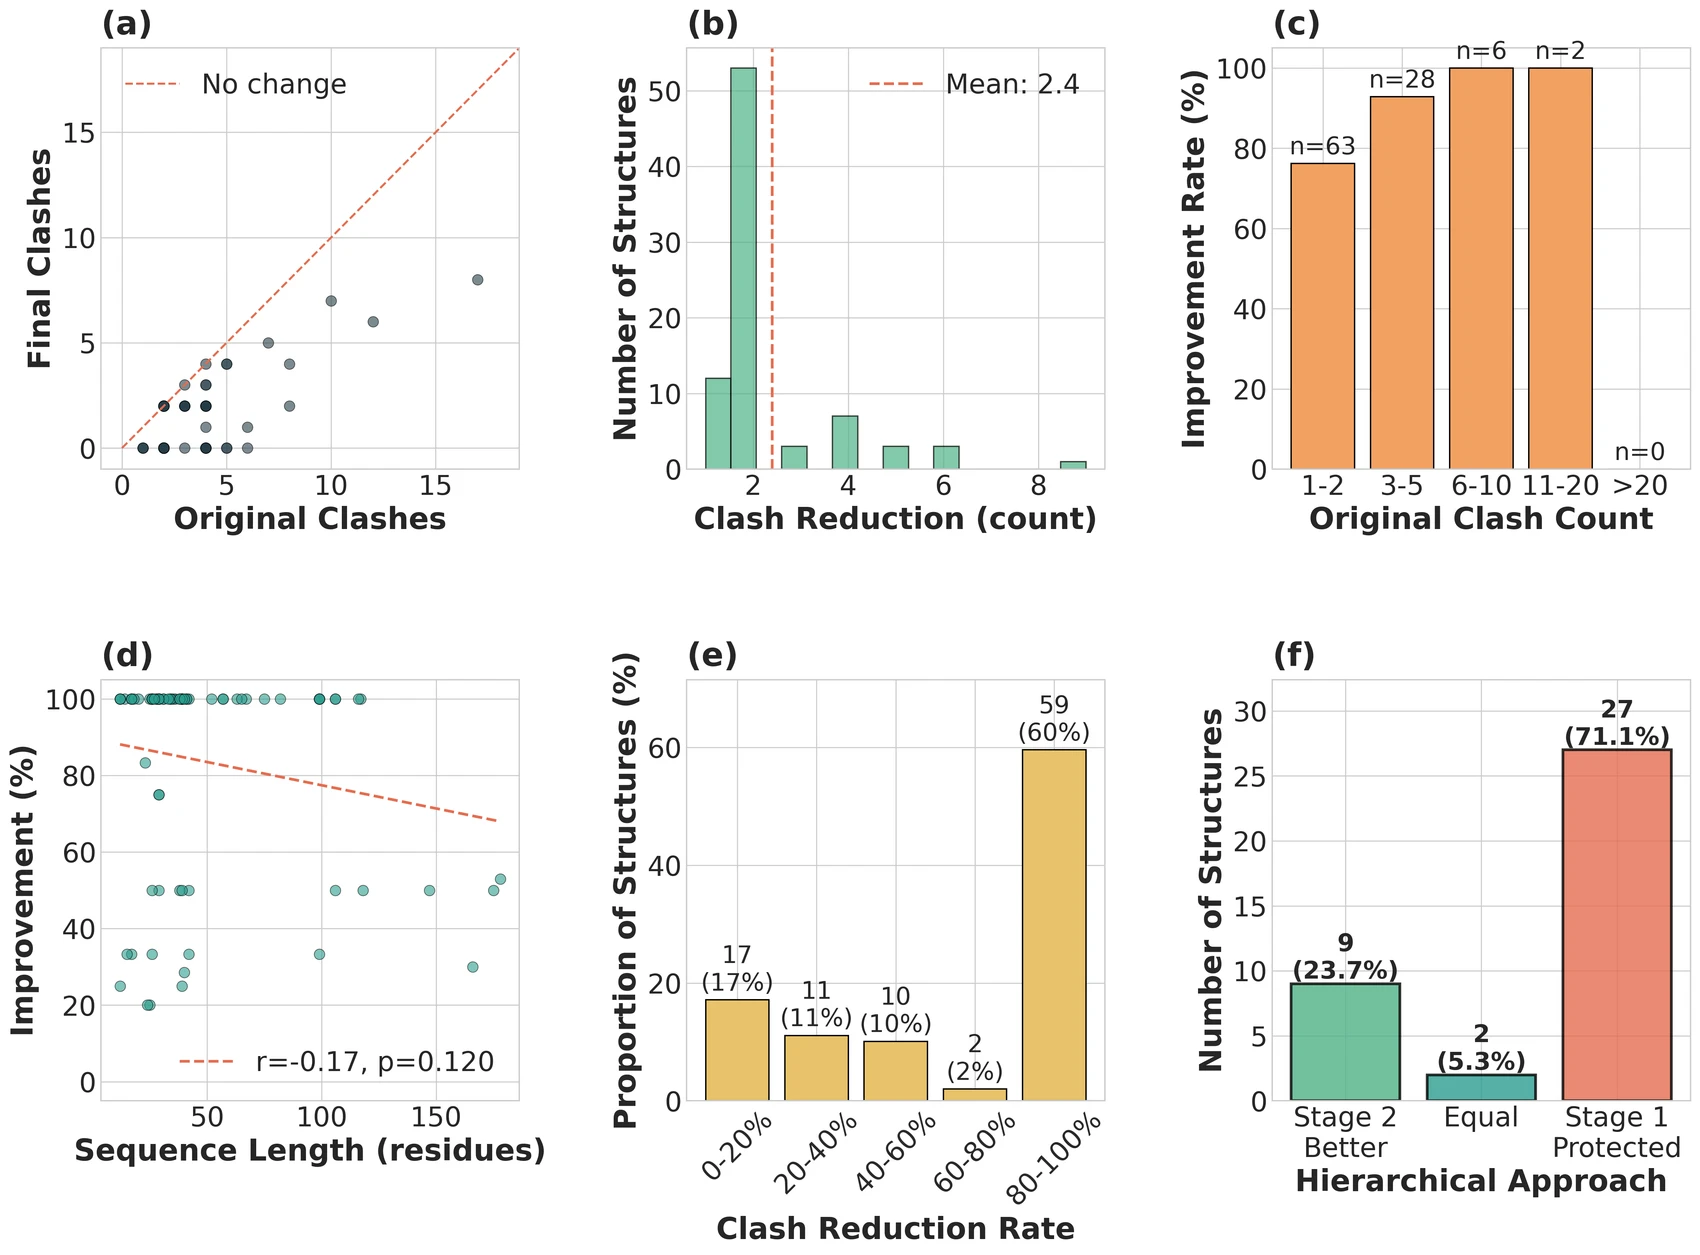
Panel a puts every structure below the identity line, which is the basic claim: fewer clashes out than in. Panel c is more interesting than it looks. Badly broken structures do better than mildly broken ones, because when three or more clashes are present the region being regenerated is large enough for the network to reason about, whereas a single isolated clash gives it almost nothing to work with. Panel d shows accuracy falling slowly with length, at r = −0.17 and p = 0.12, which is a trend rather than a result. Panel f is the honest one: on the hard cases, the second stage helps 23.7% of the time, and 71.1% of the time the pipeline decides its own output is worse and hands back the original.
Three structures
Three clashing pairs, the worst overlapping by 0.892 Å, between nucleotides with no Watson-Crick pairing to hold them apart. The model did not nudge these atoms. It rebuilt the local geometry from noise and returned a loop with nothing overlapping and nothing missing.
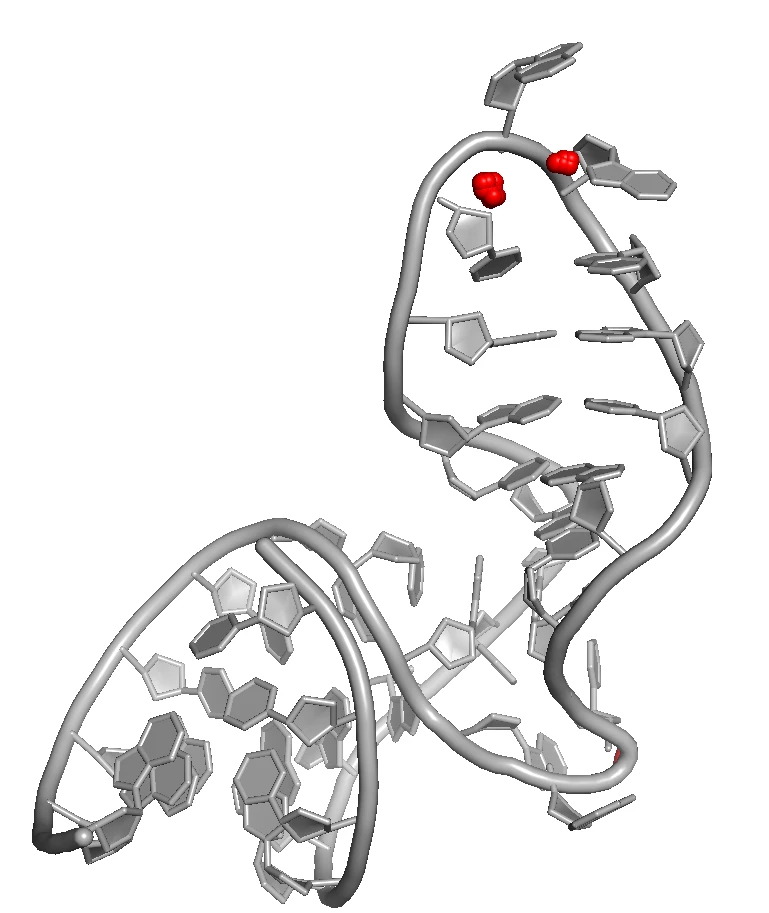
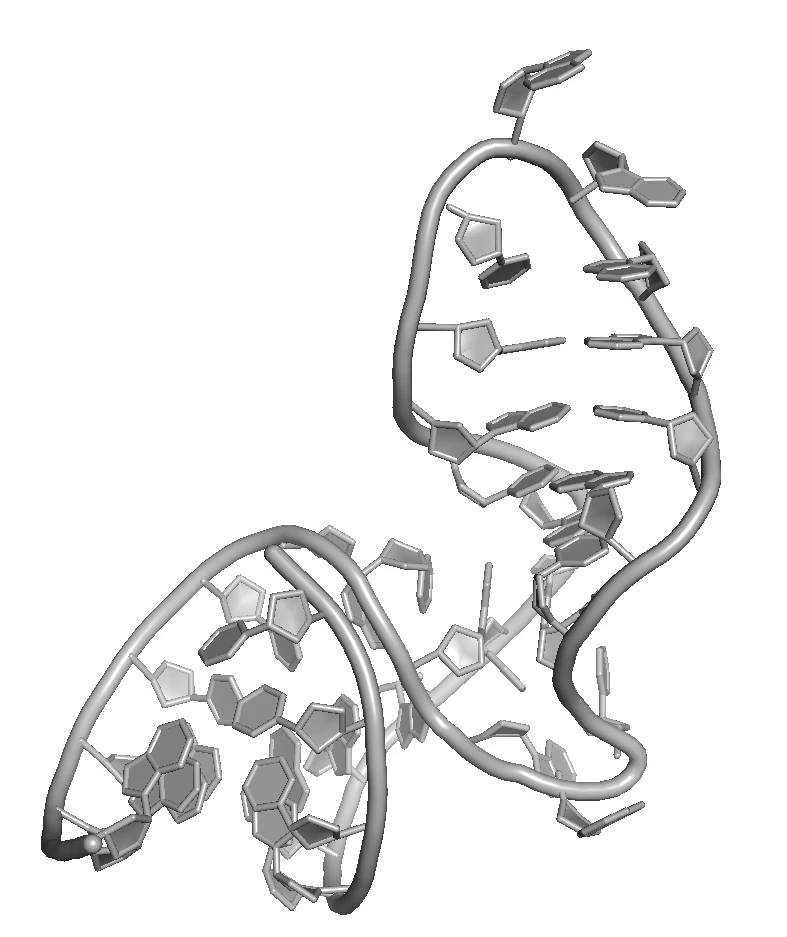
Twenty clashing pairs, worst overlap 0.804 Å. The standard pipeline holds five reference atoms per nucleotide fixed while regenerating everything else, and here that anchoring was the problem: the reference atoms were themselves misplaced, so no arrangement of the remaining atoms could resolve the clash. Zero improvement.
The second stage releases four of those five atoms, keeping only C4′ fixed, and generates coarse candidates before running the all-atom pass on each. More freedom, more conformational space, and this structure comes out clean.
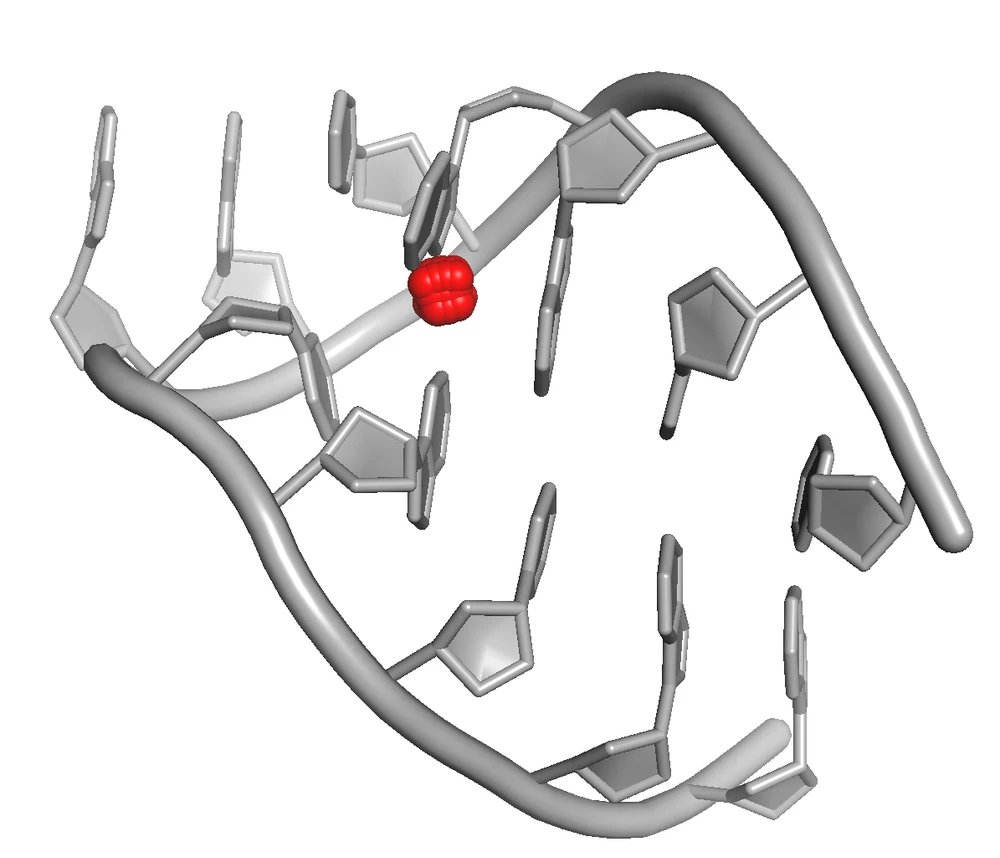
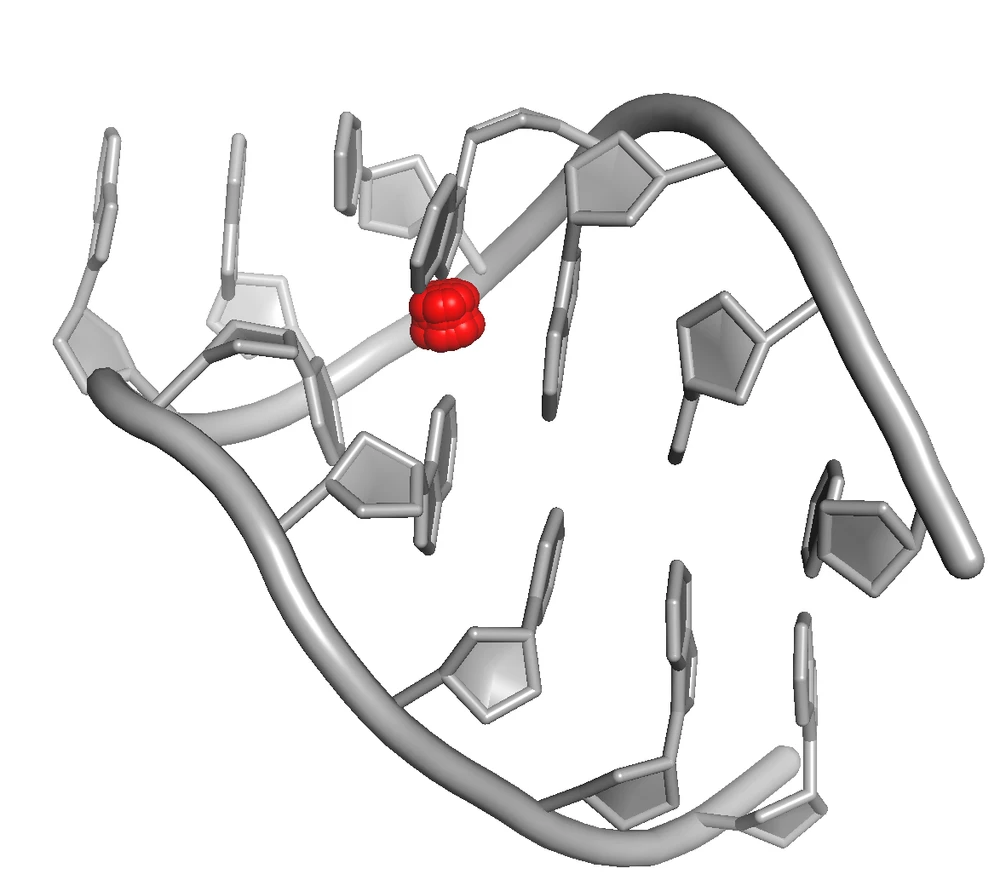
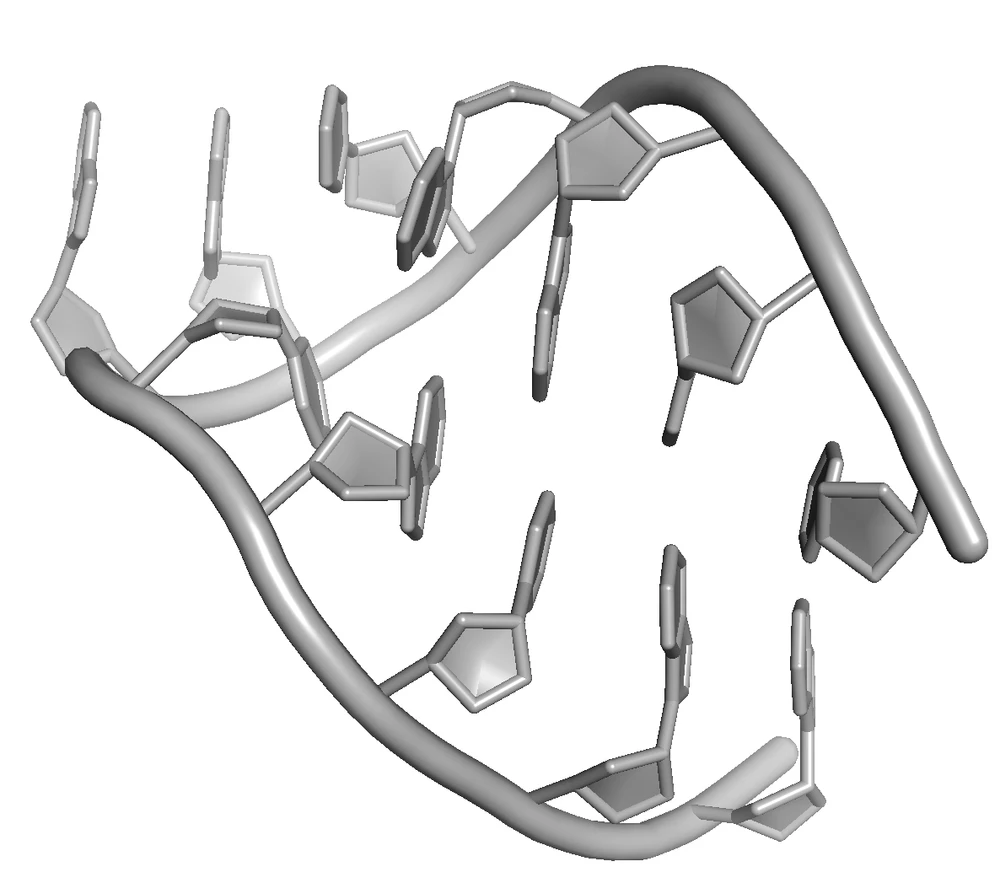
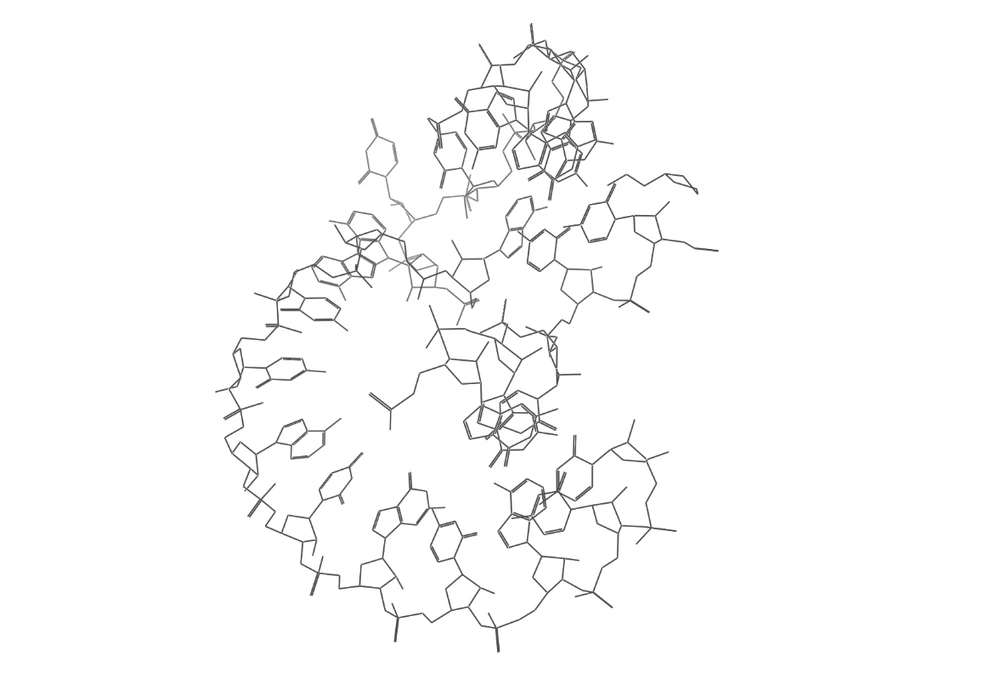
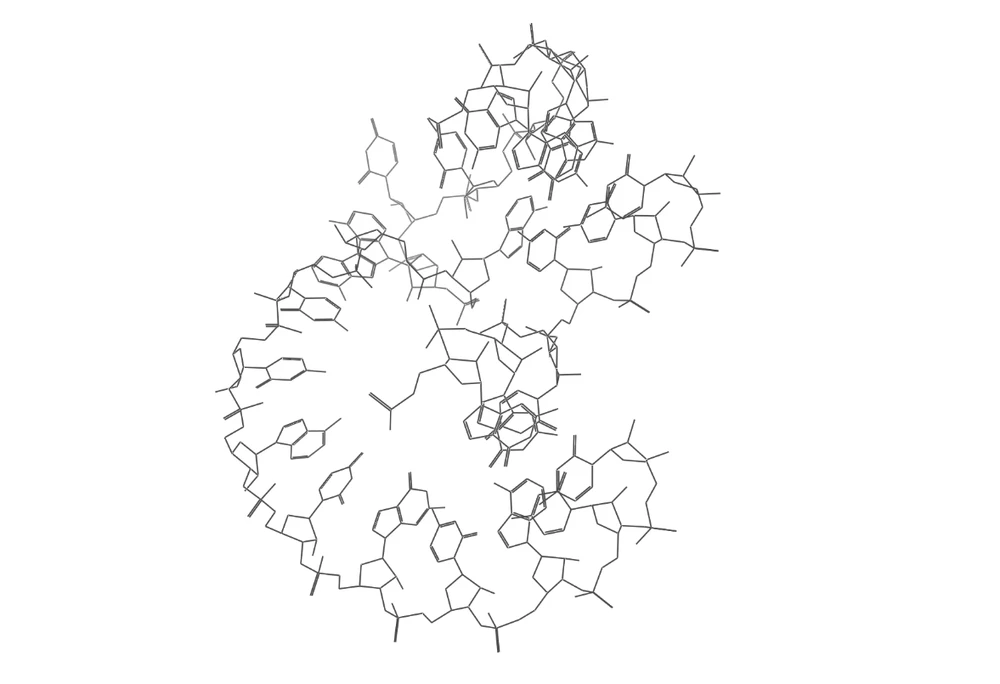
Refinement and reconstruction turn out to be the same operation. If you can regenerate a region conditioned on its surroundings, it does not matter whether that region was wrong or simply absent. Eight atoms were deleted from one residue here, across the backbone and the base, and rebuilt to within 0.018 Å of the original.
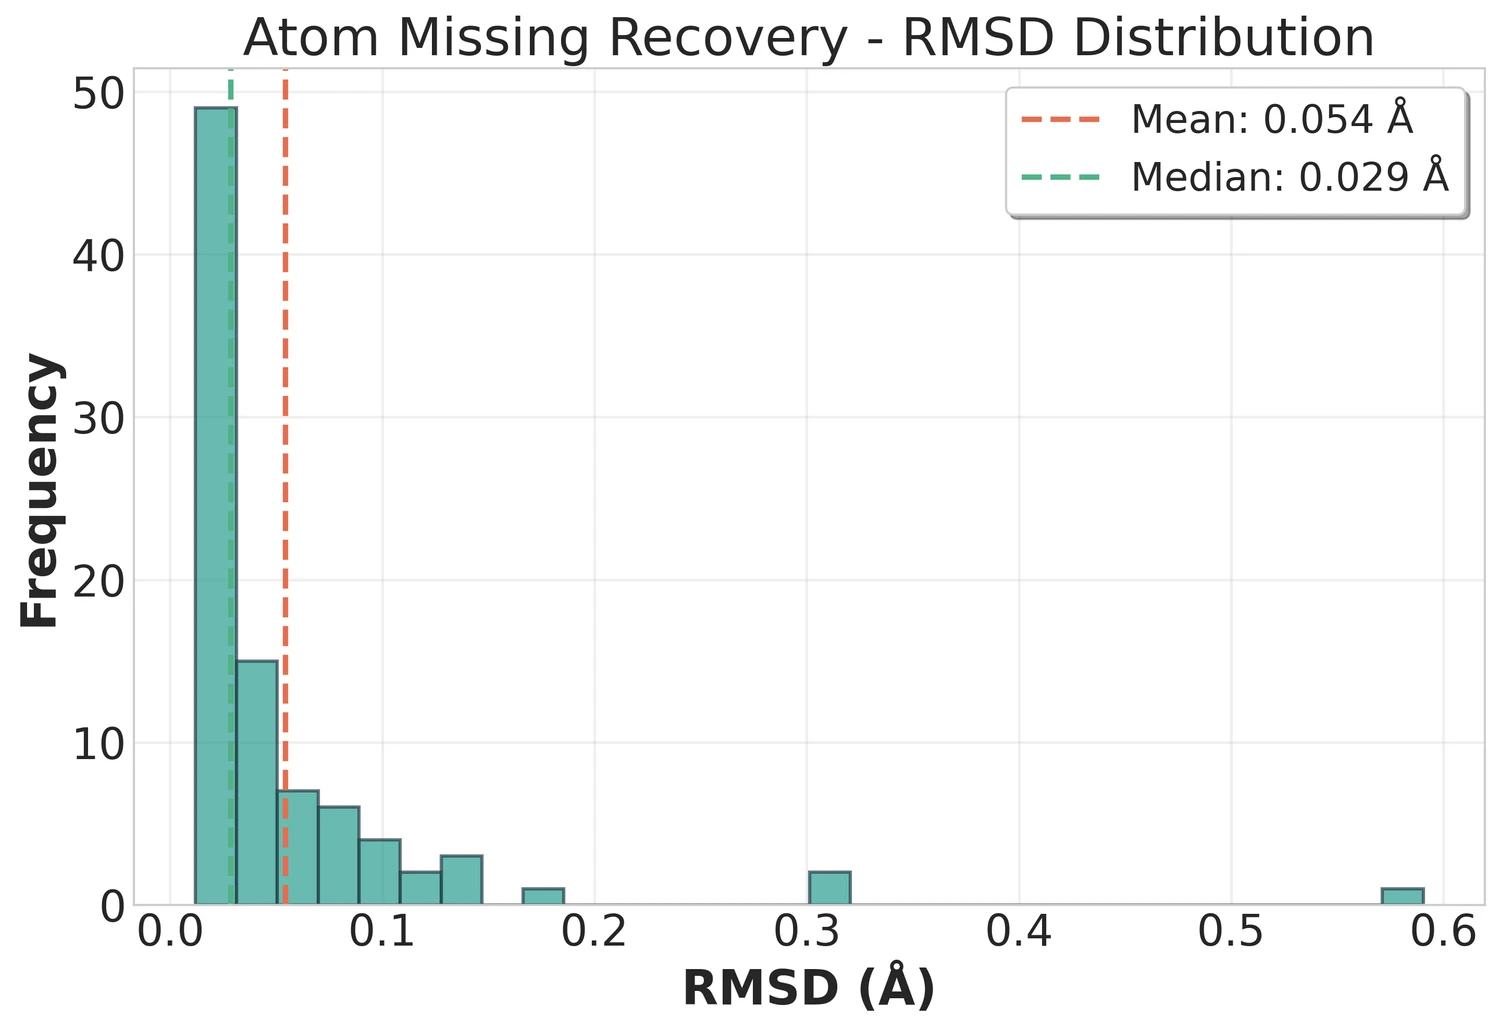
Across 90 successful cases out of 100, the median error was 0.029 Å and the mean 0.054 Å. That is well below the resolution of the experiments these files came from.
THE EDGES
The section worth reading twice
Both of these are infrastructure, and infrastructure that oversells itself is worse than none. Here is where each one stops.
The graph network holds every heavy atom as a node. Memory sets the ceiling, and the ceiling is 200 nucleotides. Ribosomal subunits and long non-coding RNAs, which is where clashes are most common, are out of reach until the graph gets sparser.
Every refinement holds the C4′ atom of each nucleotide fixed as a trustworthy anchor. When that assumption holds, it usefully constrains the problem. When the C4′ position is itself the error, the method inherits the mistake and cannot see it.
Spatial edges are drawn between nucleotides whose C4′ atoms sit within 8 Å. Anything further apart communicates only through intermediate nodes. Some genuine long-range contacts are therefore invisible to the network, and that is a deliberate trade against memory rather than a claim that they do not matter.
There is no experimental restraint anywhere in the loop. MolProbity checks whether atoms overlap, not whether the answer matches the density map the structure came from. A refined region can be chemically sound and still be the wrong conformation. Hydroxyl radical probing data or cryogenic electron microscopy maps would close that gap, and neither is in the model yet.
Every entry is one conformation from one experiment. RNA moves, and none of that motion is in the library. Modified bases such as pseudouridine and methylated nucleotides were removed to keep the graph representation consistent, so a real part of RNA biology is missing by construction. The families represented also mirror the archive's own bias toward the molecules people study.
Seventeen percent of test structures improved by 20% or less. The hierarchical stage rescues 23.7% of those. For the remaining majority the pipeline compares its best candidate against the input, finds it worse, and returns the input unchanged. That guard is the reason the aggregate numbers can be trusted, and it is also an admission that all-atom refinement has a ceiling.
THE SHORT VERSION
The RNA field has spent several years porting protein architectures across and finding that they underperform. Some of that is genuine difficulty. Some of it is that the same architecture is being fed two thousand structures instead of two hundred thousand, and a fraction of those two thousand contain geometry no molecule could adopt. ATLAS makes the archive larger by taking it apart. ChironRNA makes it more truthful by rebuilding the parts experiments could not resolve. Neither one predicts a fold, and that is the point: the interesting bottleneck was never the network.
READ THE PAPERS
Each chapter of the dissertation corresponds to a preprint on bioRxiv. Both are open access under a Creative Commons Attribution 4.0 licence, and both are mirrored here so the download works whatever bioRxiv is doing.
COLOPHON
Structural Motifs and Diffusion Refinement of RNA 3D Structures. Doctor of Philosophy in Engineering Science and Mechanics, The Pennsylvania State University, May 2026. Advised by Nikolay V. Dokholyan. Committee: Elizabeth A. Proctor, Philip C. Bevilacqua, Richard B. Mailman, Jian Wang, Laura Cabrera.
Supported by the National Institutes of Health (R35 GM134864), the National Science Foundation (2040667), the Passan Foundation, and the Penn State College of Medicine Artificial Intelligence and Biomedical Informatics Program.